Based on data from Boston Magazine, we assembled the price history of Boston apartments from 2006 to 2016. Remember we went through the financial crisis in 2008 where some cities in the states see prices drop as much as 80%.
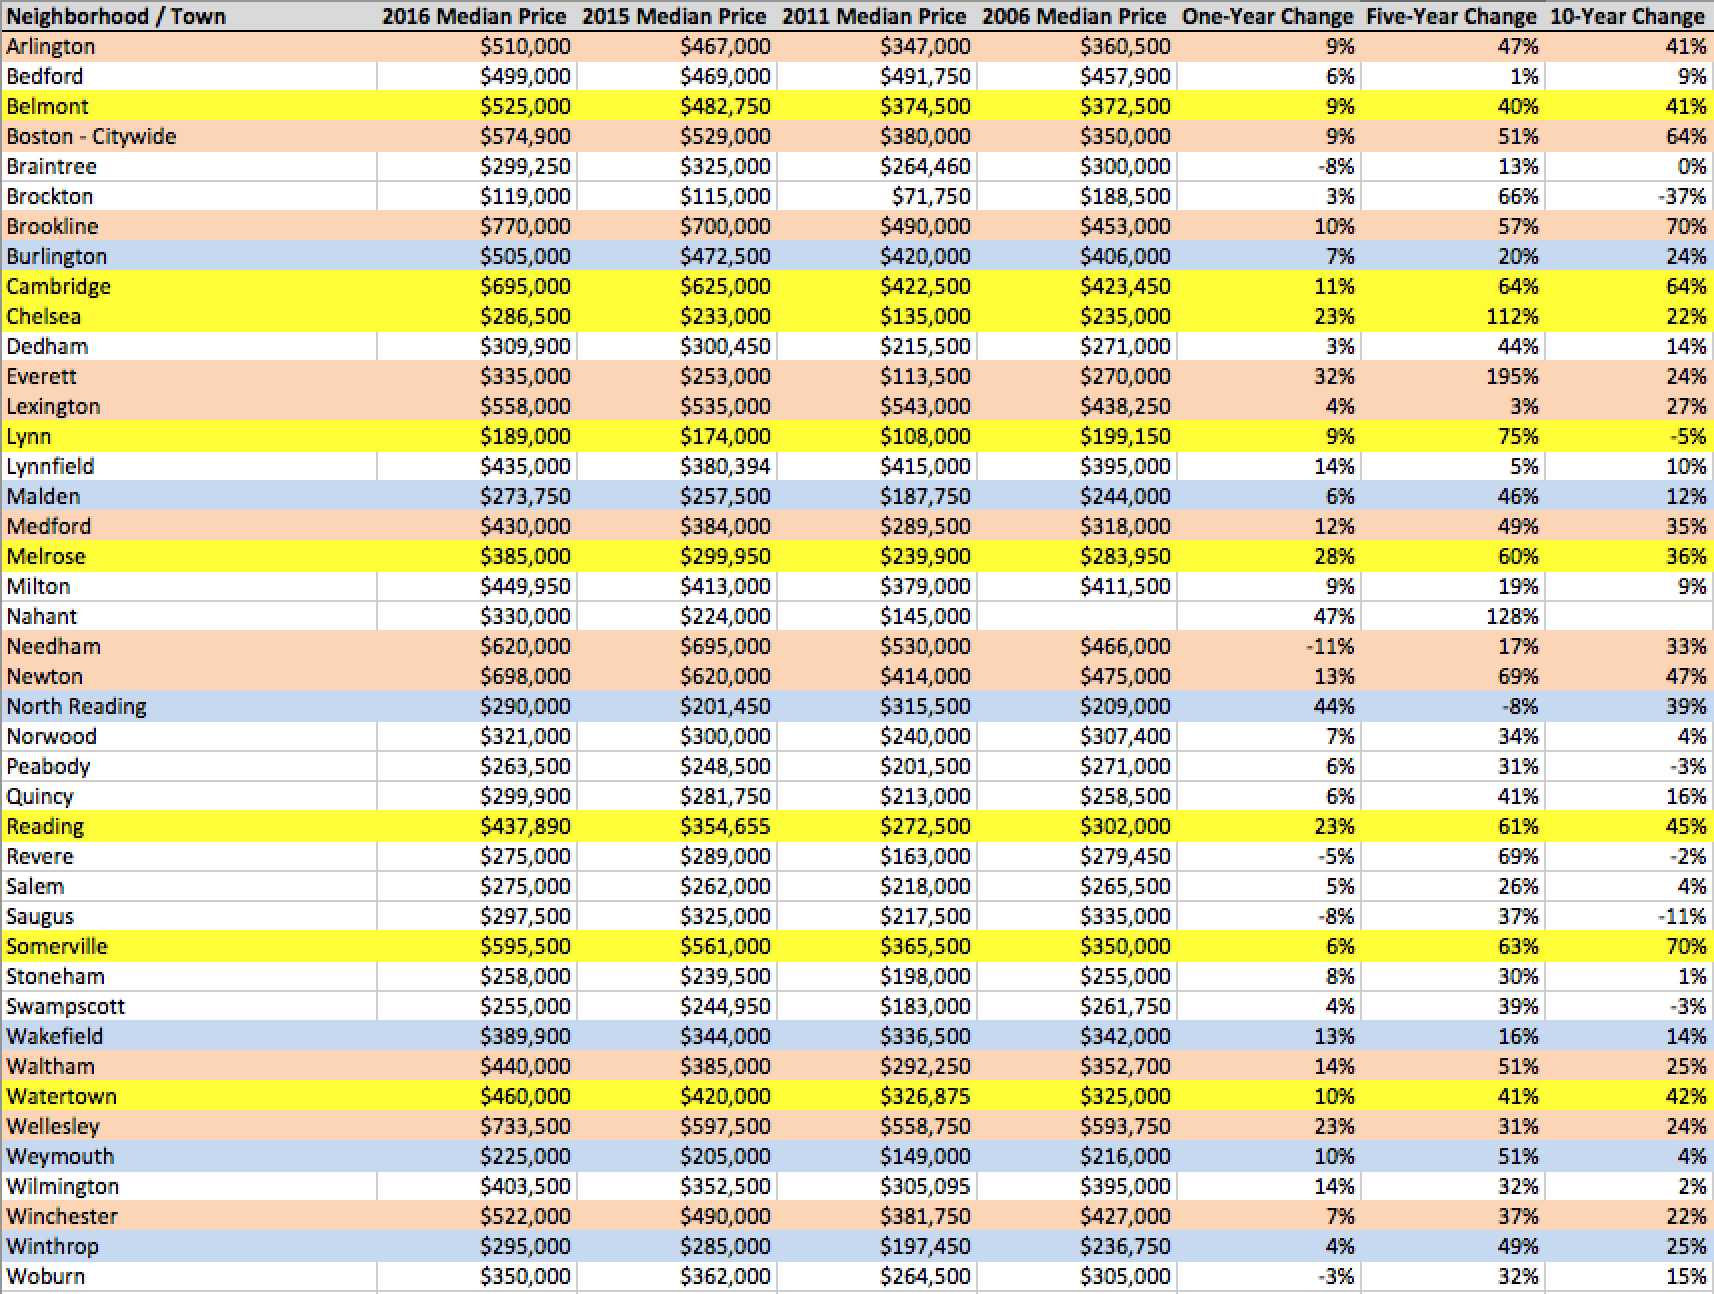
We highlighted different cities based on the price change, the days on market and other metrics.
- Red is "high resistance to crisis". The cities include Arlington, Boston and Brookline etc. We see their prices rebound the highest after financial crisis.
- Yellow is "high growth potential". We see the days on market drop year after year, meaning people are watching the supply very closely. Belmont and Cambridge etc. fall in this group.
- Blue is "growth potential". Malden and Weymouth are very popular cities in past two years.
The highlights are only for your reference. The cities with the highest appreciation in 10 years from 2006 to 2016 are Brookline and Somerville (both around 70% increase!).
If you need to consult or use a real estate agent, please contact Boston data realty.